Market Structure Based Stop LossMarket Structure Based Dynamic Stop Loss
Introduction
The Market Structure Based Stop Loss indicator is a strategic tool for traders designed to be useful in both rigorous backtesting and live testing, by providing an objective, “guess-free” stop loss level. This indicator dynamically plots suggested stop loss levels based on market structure, and the concepts of “interim lows/highs.”
It provides a robust framework for managing risk in both long and short positions. By leveraging historical price movements and real time market dynamics, this indicator helps traders identify quantitatively consistent risk levels while optimizing trade returns.
Legend
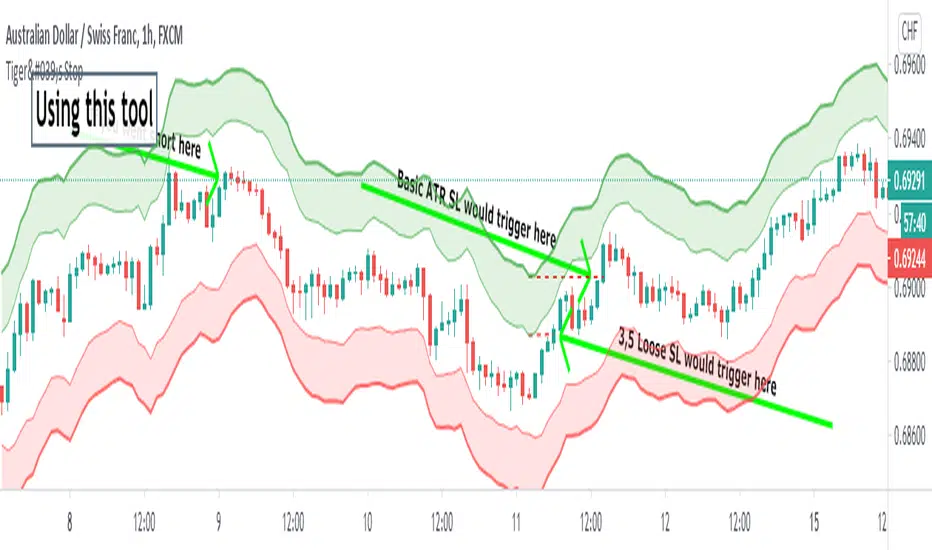
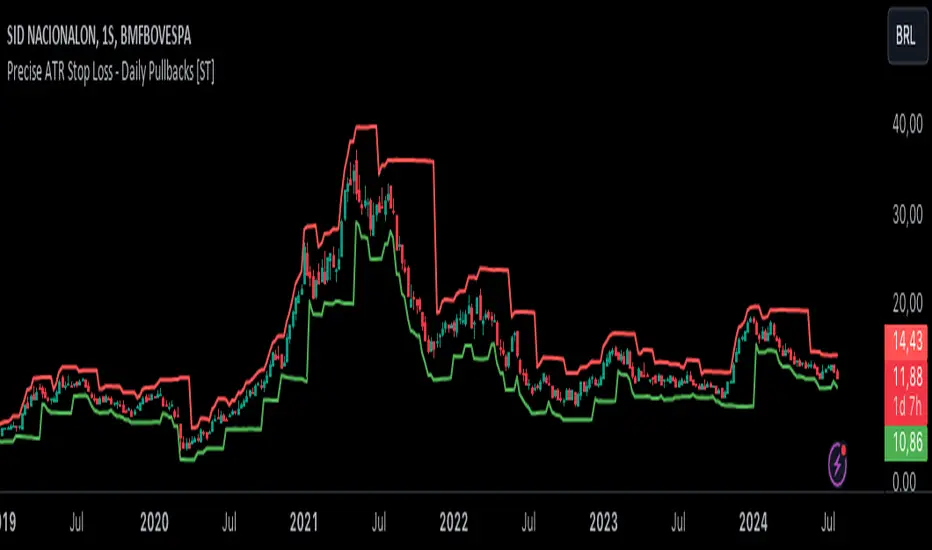
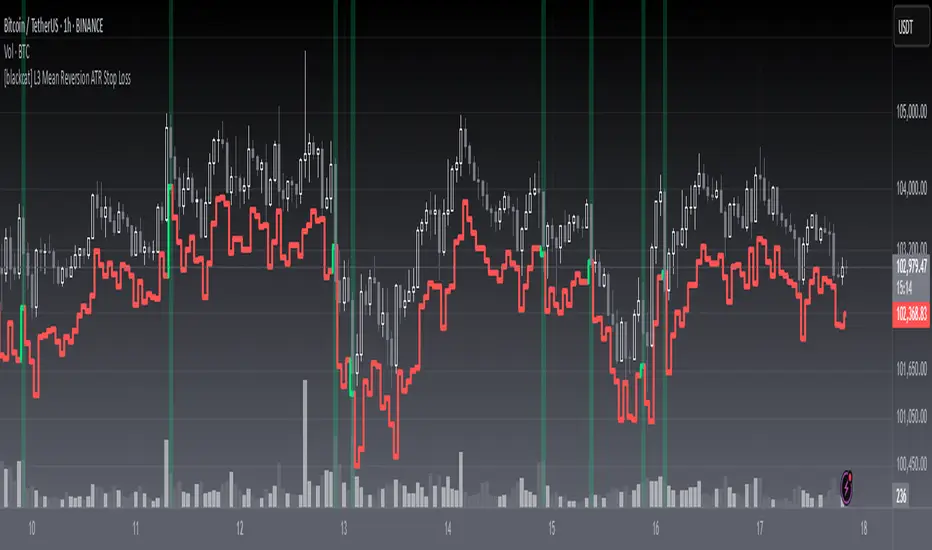
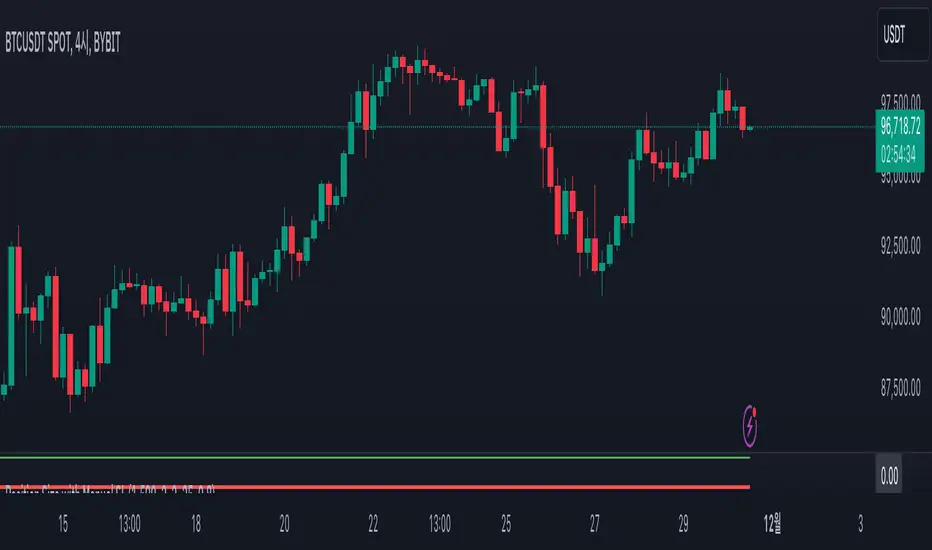
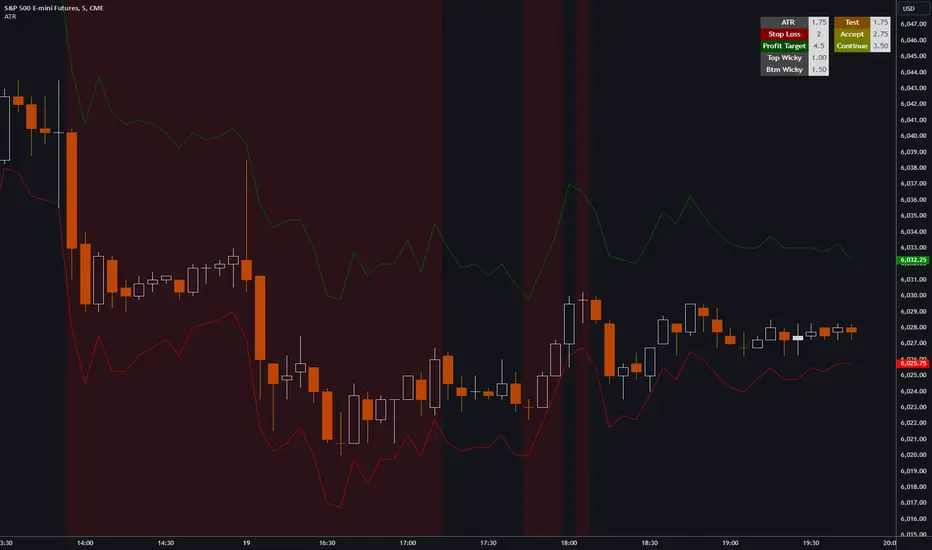
This indicator utilizes various inputs to customize its functionality, including "Stop Loss Sensitivity" and "Wick Depth," which dictate how closely the stop loss levels hug the price's highs and lows. The stop loss levels are plotted as lines on the trading chart, providing clear visual cues for position management. As seen in the chart below, this indicator dynamically plots stop loss levels for both long and short positions at every point in time.
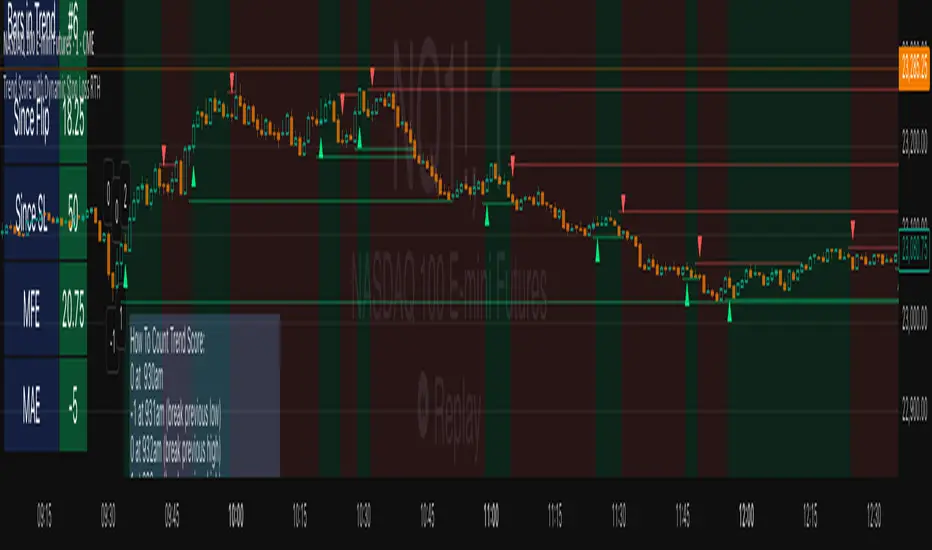
A “Stop Loss Table” is also included, in order to enhance precision trading and increase backtesting accuracy. It is customizable in both size and positioning.
Case Study
Methodology
The methodology behind this indicator focuses on the precision placement of stop losses using market structure as a guide. It calculates stop losses by identifying the "lowest close" and the corresponding "lowest low" for long setups, and inversely for short setups. By adjusting the sensitivity settings, traders can tweak the indicator's responsiveness to price changes, ensuring that the stop losses are set with a balance between tight risk control and enough room to avoid premature exits due to market noise. The indicator's ability to adapt to different trading styles and time frames makes it an essential tool for traders aiming for efficiency and effectiveness in their risk management strategies.
An important point to make is the fact that the stop loss levels are always placed within the wicks. This is important to avoid what can be described as a “floating stop loss”. A stop loss placed outside of a wick is susceptible to an outsized degree of slippage. This is because traders always cluster their stop losses at high/low wicks, and a stop loss placed outside of this level will inevitably be caught in a low liquidity cascade or “wash-out.” When price approaches a cluster of stop losses, it is highly probable that you will be stopped out anyway, so it is prudent to attempt to be the trader who gets stopped out first in order to avoid high slippage, and losses above what you originally intended.
// For long positions: stop-loss is slightly inside the lowest wick
float dynamic_SL_Long = lowestClose - (lowestClose - lowestLow) * (1 - WickDepth)
// For short positions: stop-loss is slightly inside the highest wick
float dynamic_SL_Short = highestClose + (highestHigh - highestClose) * (1 - WickDepth)
The percentage depth of the wick in which the stop loss is placed is customisable with the “Wick Depth” variable, in order to customize stop loss strategies around the liquidity of the market a trader is executing their orders in.
Penunjuk Pine Script®